Comparison Study
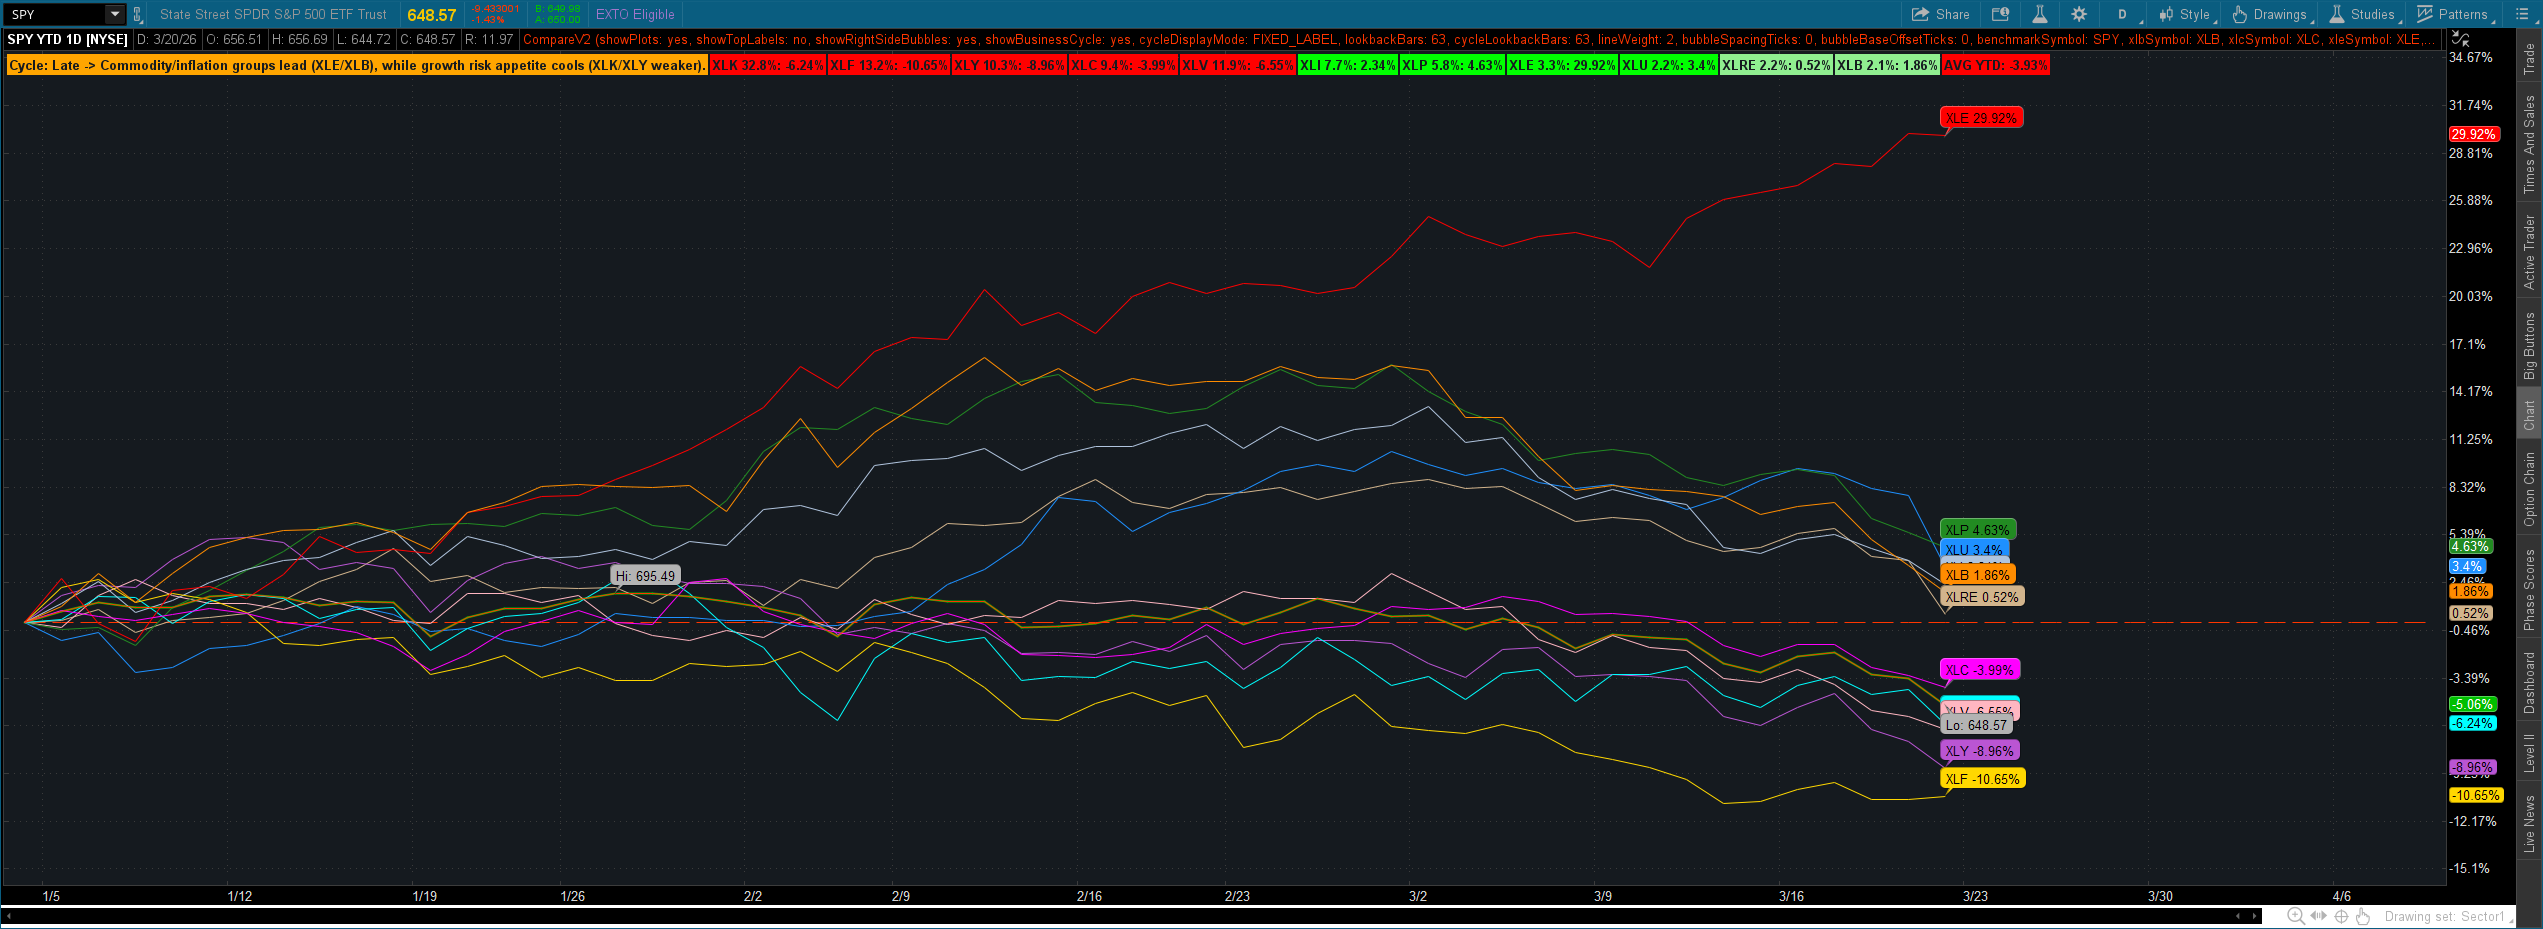
This study compares major sector ETFs, prints right-side labels with each sector ticker plus YTD and selected lookback performance, and adds a simple market regime/business-cycle hint based on sector leadership.
Open shared Flexible Grid in thinkorswim: https://tos.mx/!5dNUyEb5
What this version does
It keeps the visual comparison lines for the sector ETFs and adds labels on the right side of the chart so you can quickly scan relative performance.
Each label shows the sector symbol (for example XLE), YTD percent change, and a user-selectable lookback percent change.
It also includes a lightweight business-cycle approximation by comparing cyclical-vs-defensive sector leadership versus SPY.
ThinkScript:
# Sector Comparison + Sidebar Labels + Business Cycle Hint
# Usage:
# 1) Apply on any chart.
# 2) Set lookbackBars (for custom timeframe performance).
# 3) Toggle showPlots/showLabels/showBusinessCycle as needed.

declare upper;

input showPlots = yes;
input showTopLabels = no;
input showRightSideBubbles = yes;
input showBusinessCycle = yes;
input cycleDisplayMode = {default FIXED_LABEL, FLOATING_BUBBLE, BOTH};
input lookbackBars = 63;
input cycleLookbackBars = 63;
input lineWeight = 2;
input bubbleSpacingTicks = 80;
input bubbleBaseOffsetTicks = 200;

input benchmarkSymbol = "SPY";
input xlbSymbol = "XLB";
input xlcSymbol = "XLC";
input xleSymbol = "XLE";
input xlfSymbol = "XLF";
input xliSymbol = "XLI";
input xlkSymbol = "XLK";
input xlpSymbol = "XLP";
input xluSymbol = "XLU";
input xlvSymbol = "XLV";
input xlySymbol = "XLY";
input xlreSymbol = "XLRE";

def bn = BarNumber();
def isReady = bn > lookbackBars;
def yr = GetYear();
def newYear = yr <> yr[1];
def barsSinceYearStart = CompoundValue(1, if newYear then 1 else barsSinceYearStart[1] + 1, 1);
def useYtdForCycle = barsSinceYearStart < 63;

def benchClose = close(symbol = benchmarkSymbol);
def benchBase = CompoundValue(1, if yr != yr[1] then benchClose else benchBase[1], benchClose);
def benchYtdPct = if benchBase != 0 then (benchClose / benchBase - 1) * 100 else Double.NaN;
def benchLbPct = if useYtdForCycle then benchYtdPct else if bn > cycleLookbackBars and benchClose[cycleLookbackBars] != 0 then (benchClose / benchClose[cycleLookbackBars] - 1) * 100 else Double.NaN;

def xlbClose = close(symbol = xlbSymbol);
def xlbBase = CompoundValue(1, if newYear and !IsNaN(xlbClose) then xlbClose else if newYear and IsNaN(xlbClose) then xlbBase[1] else if IsNaN(xlbBase[1]) then xlbClose else xlbBase[1], xlbClose);
def xlbYtdPct = if xlbBase != 0 then (xlbClose / xlbBase - 1) * 100 else Double.NaN;
def xlbLbPct = if useYtdForCycle then xlbYtdPct else if bn > cycleLookbackBars and xlbClose[cycleLookbackBars] != 0 then (xlbClose / xlbClose[cycleLookbackBars] - 1) * 100 else Double.NaN;

def xlcClose = close(symbol = xlcSymbol);
def xlcBase = CompoundValue(1, if newYear and !IsNaN(xlcClose) then xlcClose else if newYear and IsNaN(xlcClose) then xlcBase[1] else if IsNaN(xlcBase[1]) then xlcClose else xlcBase[1], xlcClose);
def xlcYtdPct = if xlcBase != 0 then (xlcClose / xlcBase - 1) * 100 else Double.NaN;
def xlcLbPct = if useYtdForCycle then xlcYtdPct else if bn > cycleLookbackBars and xlcClose[cycleLookbackBars] != 0 then (xlcClose / xlcClose[cycleLookbackBars] - 1) * 100 else Double.NaN;

def xleClose = close(symbol = xleSymbol);
def xleBase = CompoundValue(1, if newYear and !IsNaN(xleClose) then xleClose else if newYear and IsNaN(xleClose) then xleBase[1] else if IsNaN(xleBase[1]) then xleClose else xleBase[1], xleClose);
def xleYtdPct = if xleBase != 0 then (xleClose / xleBase - 1) * 100 else Double.NaN;
def xleLbPct = if useYtdForCycle then xleYtdPct else if bn > cycleLookbackBars and xleClose[cycleLookbackBars] != 0 then (xleClose / xleClose[cycleLookbackBars] - 1) * 100 else Double.NaN;

def xlfClose = close(symbol = xlfSymbol);
def xlfBase = CompoundValue(1, if newYear and !IsNaN(xlfClose) then xlfClose else if newYear and IsNaN(xlfClose) then xlfBase[1] else if IsNaN(xlfBase[1]) then xlfClose else xlfBase[1], xlfClose);
def xlfYtdPct = if xlfBase != 0 then (xlfClose / xlfBase - 1) * 100 else Double.NaN;
def xlfLbPct = if useYtdForCycle then xlfYtdPct else if bn > cycleLookbackBars and xlfClose[cycleLookbackBars] != 0 then (xlfClose / xlfClose[cycleLookbackBars] - 1) * 100 else Double.NaN;

def xliClose = close(symbol = xliSymbol);
def xliBase = CompoundValue(1, if newYear and !IsNaN(xliClose) then xliClose else if newYear and IsNaN(xliClose) then xliBase[1] else if IsNaN(xliBase[1]) then xliClose else xliBase[1], xliClose);
def xliYtdPct = if xliBase != 0 then (xliClose / xliBase - 1) * 100 else Double.NaN;
def xliLbPct = if useYtdForCycle then xliYtdPct else if bn > cycleLookbackBars and xliClose[cycleLookbackBars] != 0 then (xliClose / xliClose[cycleLookbackBars] - 1) * 100 else Double.NaN;

def xlkClose = close(symbol = xlkSymbol);
def xlkBase = CompoundValue(1, if newYear and !IsNaN(xlkClose) then xlkClose else if newYear and IsNaN(xlkClose) then xlkBase[1] else if IsNaN(xlkBase[1]) then xlkClose else xlkBase[1], xlkClose);
def xlkYtdPct = if xlkBase != 0 then (xlkClose / xlkBase - 1) * 100 else Double.NaN;
def xlkLbPct = if useYtdForCycle then xlkYtdPct else if bn > cycleLookbackBars and xlkClose[cycleLookbackBars] != 0 then (xlkClose / xlkClose[cycleLookbackBars] - 1) * 100 else Double.NaN;

def xlpClose = close(symbol = xlpSymbol);
def xlpBase = CompoundValue(1, if newYear and !IsNaN(xlpClose) then xlpClose else if newYear and IsNaN(xlpClose) then xlpBase[1] else if IsNaN(xlpBase[1]) then xlpClose else xlpBase[1], xlpClose);
def xlpYtdPct = if xlpBase != 0 then (xlpClose / xlpBase - 1) * 100 else Double.NaN;
def xlpLbPct = if useYtdForCycle then xlpYtdPct else if bn > cycleLookbackBars and xlpClose[cycleLookbackBars] != 0 then (xlpClose / xlpClose[cycleLookbackBars] - 1) * 100 else Double.NaN;

def xluClose = close(symbol = xluSymbol);
def xluBase = CompoundValue(1, if newYear and !IsNaN(xluClose) then xluClose else if newYear and IsNaN(xluClose) then xluBase[1] else if IsNaN(xluBase[1]) then xluClose else xluBase[1], xluClose);
def xluYtdPct = if xluBase != 0 then (xluClose / xluBase - 1) * 100 else Double.NaN;
def xluLbPct = if useYtdForCycle then xluYtdPct else if bn > cycleLookbackBars and xluClose[cycleLookbackBars] != 0 then (xluClose / xluClose[cycleLookbackBars] - 1) * 100 else Double.NaN;

def xlvClose = close(symbol = xlvSymbol);
def xlvBase = CompoundValue(1, if newYear and !IsNaN(xlvClose) then xlvClose else if newYear and IsNaN(xlvClose) then xlvBase[1] else if IsNaN(xlvBase[1]) then xlvClose else xlvBase[1], xlvClose);
def xlvYtdPct = if xlvBase != 0 then (xlvClose / xlvBase - 1) * 100 else Double.NaN;
def xlvLbPct = if useYtdForCycle then xlvYtdPct else if bn > cycleLookbackBars and xlvClose[cycleLookbackBars] != 0 then (xlvClose / xlvClose[cycleLookbackBars] - 1) * 100 else Double.NaN;

def xlyClose = close(symbol = xlySymbol);
def xlyBase = CompoundValue(1, if newYear and !IsNaN(xlyClose) then xlyClose else if newYear and IsNaN(xlyClose) then xlyBase[1] else if IsNaN(xlyBase[1]) then xlyClose else xlyBase[1], xlyClose);
def xlyYtdPct = if xlyBase != 0 then (xlyClose / xlyBase - 1) * 100 else Double.NaN;
def xlyLbPct = if useYtdForCycle then xlyYtdPct else if bn > cycleLookbackBars and xlyClose[cycleLookbackBars] != 0 then (xlyClose / xlyClose[cycleLookbackBars] - 1) * 100 else Double.NaN;

def xlreClose = close(symbol = xlreSymbol);
def xlreBase = CompoundValue(1, if newYear and !IsNaN(xlreClose) then xlreClose else if newYear and IsNaN(xlreClose) then xlreBase[1] else if IsNaN(xlreBase[1]) then xlreClose else xlreBase[1], xlreClose);
def xlreYtdPct = if xlreBase != 0 then (xlreClose / xlreBase - 1) * 100 else Double.NaN;
def xlreLbPct = if useYtdForCycle then xlreYtdPct else if bn > cycleLookbackBars and xlreClose[cycleLookbackBars] != 0 then (xlreClose / xlreClose[cycleLookbackBars] - 1) * 100 else Double.NaN;

plot Benchmark = if showPlots then benchClose else Double.NaN;
plot XLB = if showPlots and benchBase != 0 then benchBase * (1 + xlbYtdPct / 100) else Double.NaN;
plot XLC = if showPlots and benchBase != 0 then benchBase * (1 + xlcYtdPct / 100) else Double.NaN;
plot XLE = if showPlots and benchBase != 0 then benchBase * (1 + xleYtdPct / 100) else Double.NaN;
plot XLF = if showPlots and benchBase != 0 then benchBase * (1 + xlfYtdPct / 100) else Double.NaN;
plot XLI = if showPlots and benchBase != 0 then benchBase * (1 + xliYtdPct / 100) else Double.NaN;
plot XLK = if showPlots and benchBase != 0 then benchBase * (1 + xlkYtdPct / 100) else Double.NaN;
plot XLP = if showPlots and benchBase != 0 then benchBase * (1 + xlpYtdPct / 100) else Double.NaN;
plot XLU = if showPlots and benchBase != 0 then benchBase * (1 + xluYtdPct / 100) else Double.NaN;
plot XLV = if showPlots and benchBase != 0 then benchBase * (1 + xlvYtdPct / 100) else Double.NaN;
plot XLY = if showPlots and benchBase != 0 then benchBase * (1 + xlyYtdPct / 100) else Double.NaN;
plot XLRE = if showPlots and benchBase != 0 then benchBase * (1 + xlreYtdPct / 100) else Double.NaN;
plot ZeroLine = if showPlots then benchBase else Double.NaN;

Benchmark.SetDefaultColor(Color.WHITE);
Benchmark.SetLineWeight(lineWeight + 1);

XLB.SetDefaultColor(CreateColor(255, 140, 0));
XLC.SetDefaultColor(CreateColor(255, 0, 255));
XLE.SetDefaultColor(Color.RED);
XLF.SetDefaultColor(CreateColor(255, 215, 0));
XLI.SetDefaultColor(CreateColor(176, 196, 222));
XLK.SetDefaultColor(Color.CYAN);
XLP.SetDefaultColor(CreateColor(34, 139, 34));
XLU.SetDefaultColor(CreateColor(30, 144, 255));
XLV.SetDefaultColor(CreateColor(255, 182, 193));
XLY.SetDefaultColor(CreateColor(186, 85, 211));
XLRE.SetDefaultColor(CreateColor(210, 180, 140));
ZeroLine.SetDefaultColor(Color.GRAY);
ZeroLine.SetStyle(Curve.SHORT_DASH);
ZeroLine.SetLineWeight(1);

XLB.SetLineWeight(lineWeight);
XLC.SetLineWeight(lineWeight);
XLE.SetLineWeight(lineWeight);
XLF.SetLineWeight(lineWeight);
XLI.SetLineWeight(lineWeight);
XLK.SetLineWeight(lineWeight);
XLP.SetLineWeight(lineWeight);
XLU.SetLineWeight(lineWeight);
XLV.SetLineWeight(lineWeight);
XLY.SetLineWeight(lineWeight);
XLRE.SetLineWeight(lineWeight);

AddLabel(showTopLabels, benchmarkSymbol + " YTD: " + AsPercent(benchYtdPct / 100) + " | " + lookbackBars + "b: " + AsPercent(benchLbPct / 100), if benchYtdPct >= 0 then Color.GREEN else Color.RED);
AddLabel(showTopLabels, xlkSymbol + ": " + AsPercent(xlkYtdPct / 100), if xlkYtdPct >= 0 then Color.GREEN else Color.RED);
AddLabel(showTopLabels, xlfSymbol + ": " + AsPercent(xlfYtdPct / 100), if xlfYtdPct >= 0 then Color.GREEN else Color.RED);
AddLabel(showTopLabels, xlvSymbol + ": " + AsPercent(xlvYtdPct / 100), if xlvYtdPct >= 0 then Color.GREEN else Color.RED);
AddLabel(showTopLabels, xlySymbol + ": " + AsPercent(xlyYtdPct / 100), if xlyYtdPct >= 0 then Color.GREEN else Color.RED);
AddLabel(showTopLabels, xliSymbol + ": " + AsPercent(xliYtdPct / 100), if xliYtdPct >= 0 then Color.GREEN else Color.RED);
AddLabel(showTopLabels, xlcSymbol + ": " + AsPercent(xlcYtdPct / 100), if xlcYtdPct >= 0 then Color.GREEN else Color.RED);
AddLabel(showTopLabels, xlpSymbol + ": " + AsPercent(xlpYtdPct / 100), if xlpYtdPct >= 0 then Color.GREEN else Color.RED);
AddLabel(showTopLabels, xleSymbol + ": " + AsPercent(xleYtdPct / 100), if xleYtdPct >= 0 then Color.GREEN else Color.RED);
AddLabel(showTopLabels, xluSymbol + ": " + AsPercent(xluYtdPct / 100), if xluYtdPct >= 0 then Color.GREEN else Color.RED);
AddLabel(showTopLabels, xlreSymbol + ": " + AsPercent(xlreYtdPct / 100), if xlreYtdPct >= 0 then Color.GREEN else Color.RED);
AddLabel(showTopLabels, xlbSymbol + ": " + AsPercent(xlbYtdPct / 100), if xlbYtdPct >= 0 then Color.GREEN else Color.RED);

def cyclicalScore =
    (if xlkLbPct > benchLbPct then 1 else 0) +
    (if xlyLbPct > benchLbPct then 1 else 0) +
    (if xliLbPct > benchLbPct then 1 else 0) +
    (if xlfLbPct > benchLbPct then 1 else 0) +
    (if xleLbPct > benchLbPct then 1 else 0) +
    (if xlbLbPct > benchLbPct then 1 else 0);

def defensiveScore =
    (if xlpLbPct > benchLbPct then 1 else 0) +
    (if xluLbPct > benchLbPct then 1 else 0) +
    (if xlvLbPct > benchLbPct then 1 else 0) +
    (if xlreLbPct > benchLbPct then 1 else 0);

def regimeScore = cyclicalScore - defensiveScore;
def isExpansion = regimeScore >= 3;
def isSlowdown = regimeScore <= -2;
def isCycleReady = !IsNaN(benchLbPct);
def earlySignal = xlyLbPct > benchLbPct and xlfLbPct > benchLbPct and xliLbPct > benchLbPct;
def midSignal = xlkLbPct > benchLbPct and xlcLbPct > benchLbPct;
def lateSignal = xleLbPct > benchLbPct and xlbLbPct > benchLbPct;
def recessionSignal = xlpLbPct > benchLbPct and xluLbPct > benchLbPct and xlvLbPct > benchLbPct;

AddLabel(showBusinessCycle and (cycleDisplayMode == cycleDisplayMode.FIXED_LABEL or cycleDisplayMode == cycleDisplayMode.BOTH),
    if !isCycleReady then "Cycle: Not Ready"
    else if recessionSignal and defensiveScore >= 3 then "Cycle: Recession -> Defensive leadership dominates (XLP/XLU/XLV outperform SPY); cyclicals lag (XLI/XLRE/XLK)."
    else if lateSignal and (isSlowdown or defensiveScore >= 2) then "Cycle: Late -> Commodity/inflation groups lead (XLE/XLB), while growth risk appetite cools (XLK/XLY weaker)."
    else if midSignal and cyclicalScore >= 3 then "Cycle: Mid Expansion -> Broad risk participation with Tech/Comms strength (XLK/XLC); leadership rotates."
    else if earlySignal and cyclicalScore >= 3 then "Cycle: Early Recovery -> Consumer/Financial/Industrial leadership (XLY/XLF/XLI) with defensives lagging."
    else "Cycle: Transition -> Mixed leadership, no clear phase dominance yet. C:" + cyclicalScore + " D:" + defensiveScore,
    if !isCycleReady then Color.LIGHT_GRAY
    else if recessionSignal and defensiveScore >= 3 then Color.RED
    else if lateSignal and (isSlowdown or defensiveScore >= 2) then CreateColor(255, 165, 0)
    else if midSignal and cyclicalScore >= 3 then Color.CYAN
    else if earlySignal and cyclicalScore >= 3 then Color.GREEN
    else Color.YELLOW
);

def lastBar = !IsNaN(close) and IsNaN(close[-1]);
def step = TickSize() * bubbleSpacingTicks;
AddChartBubble(showRightSideBubbles and lastBar, XLB + 0 * step, xlbSymbol + " " + AsPercent(xlbYtdPct / 100), XLB.TakeValueColor(), yes);
AddChartBubble(showRightSideBubbles and lastBar, XLC + 1 * step, xlcSymbol + " " + AsPercent(xlcYtdPct / 100), XLC.TakeValueColor(), yes);
AddChartBubble(showRightSideBubbles and lastBar, XLE + 2 * step, xleSymbol + " " + AsPercent(xleYtdPct / 100), XLE.TakeValueColor(), yes);
AddChartBubble(showRightSideBubbles and lastBar, XLF + 3 * step, xlfSymbol + " " + AsPercent(xlfYtdPct / 100), XLF.TakeValueColor(), yes);
AddChartBubble(showRightSideBubbles and lastBar, XLI + 4 * step, xliSymbol + " " + AsPercent(xliYtdPct / 100), XLI.TakeValueColor(), yes);
AddChartBubble(showRightSideBubbles and lastBar, XLK + 5 * step, xlkSymbol + " " + AsPercent(xlkYtdPct / 100), XLK.TakeValueColor(), yes);
AddChartBubble(showRightSideBubbles and lastBar, XLP + 6 * step, xlpSymbol + " " + AsPercent(xlpYtdPct / 100), XLP.TakeValueColor(), yes);
AddChartBubble(showRightSideBubbles and lastBar, XLU + 7 * step, xluSymbol + " " + AsPercent(xluYtdPct / 100), XLU.TakeValueColor(), yes);
AddChartBubble(showRightSideBubbles and lastBar, XLV + 8 * step, xlvSymbol + " " + AsPercent(xlvYtdPct / 100), XLV.TakeValueColor(), yes);
AddChartBubble(showRightSideBubbles and lastBar, XLY + 9 * step, xlySymbol + " " + AsPercent(xlyYtdPct / 100), XLY.TakeValueColor(), yes);
AddChartBubble(showRightSideBubbles and lastBar, XLRE + 10 * step, xlreSymbol + " " + AsPercent(xlreYtdPct / 100), XLRE.TakeValueColor(), yes);

AddChartBubble(showBusinessCycle and lastBar and (cycleDisplayMode == cycleDisplayMode.FLOATING_BUBBLE or cycleDisplayMode == cycleDisplayMode.BOTH),
    Benchmark + 12 * step,
    if !isCycleReady then "Cycle: Not Ready"
    else if recessionSignal and defensiveScore >= 3 then "Cycle: Recession -> Defensive leadership dominates (XLP/XLU/XLV outperform SPY); cyclicals lag."
    else if lateSignal and (isSlowdown or defensiveScore >= 2) then "Cycle: Late -> XLE/XLB leadership suggests inflation/slowdown pressure; growth sectors lag."
    else if midSignal and cyclicalScore >= 3 then "Cycle: Mid Expansion -> XLK/XLC lead with broad cyclical participation and sector rotation."
    else if earlySignal and cyclicalScore >= 3 then "Cycle: Early Recovery -> XLY/XLF/XLI leadership shows reopening/risk-on behavior."
    else "Cycle: Transition -> Mixed leadership, no clear phase dominance. C:" + cyclicalScore + " D:" + defensiveScore,
    if !isCycleReady then Color.LIGHT_GRAY
    else if recessionSignal and defensiveScore >= 3 then Color.RED
    else if lateSignal and (isSlowdown or defensiveScore >= 2) then CreateColor(255, 165, 0)
    else if midSignal and cyclicalScore >= 3 then Color.CYAN
    else if earlySignal and cyclicalScore >= 3 then Color.GREEN
    else Color.YELLOW,
    yes
);
What this version does
This business-cycle label is a practical proxy, not a macro model. It uses relative strength leadership over your selected lookback window.
If cyclical sectors lead versus SPY, the label leans expansion/risk-on. If defensive sectors lead, it leans slowdown/defensive.
For stronger confidence, pair this with your macro data workflow and price structure on higher timeframes.
Business Cycle Sector Leadership by Phase
Early Cycle (Recovery)
Description: The economy rebounds from recession; interest rates are low, and growth begins to accelerate.
Leaders: Consumer Discretionary, Financials, Industrials, and Information Technology typically outperform as they benefit from new spending and lower borrowing costs.
Laggards: Defensive sectors like Utilities and Health Care often trail the broader market.
Mid Cycle (Expansion)
Description: The longest phase where growth is solid but moderates; corporate profits are healthy.
Leaders: Information Technology is historically the strongest performer as companies increase capital expenditures. Communication Services also tends to perform well.
Note: This phase often lacks a single dominant leader, leading to frequent rotation between sectors.
Late Cycle (Slowdown)
Description: Growth peaks and starts to slow; inflation and interest rates often rise.
Leaders: Energy and Materials often lead as commodity prices climb. Defensive sectors like Health Care and Utilities may also begin to gain traction as investors seek safety.
Laggards: Information Technology and Consumer Discretionary usually begin to underperform.
Recession (Contraction)
Description: Economic activity and corporate profits decline.
Leaders: Defensive sectors—Consumer Staples, Utilities, and Health Care—typically outperform because they provide essential goods and services that people buy regardless of the economy.
Laggards: Economically sensitive sectors like Industrials, Real Estate, and Technology generally see the largest declines